
API usage & statistics
The Usage & Statistics dashboard shows how your integration consumes the API over time. Use it to keep performance healthy, stay within limits, and diagnose issues before they affect production.
Why track usage?
- Prevent rate-limit surprises
- Understand real traffic patterns
- Detect bugs early (retry loops, polling, batch spikes)
- Optimize your integration as you scale
-
Dashboard views
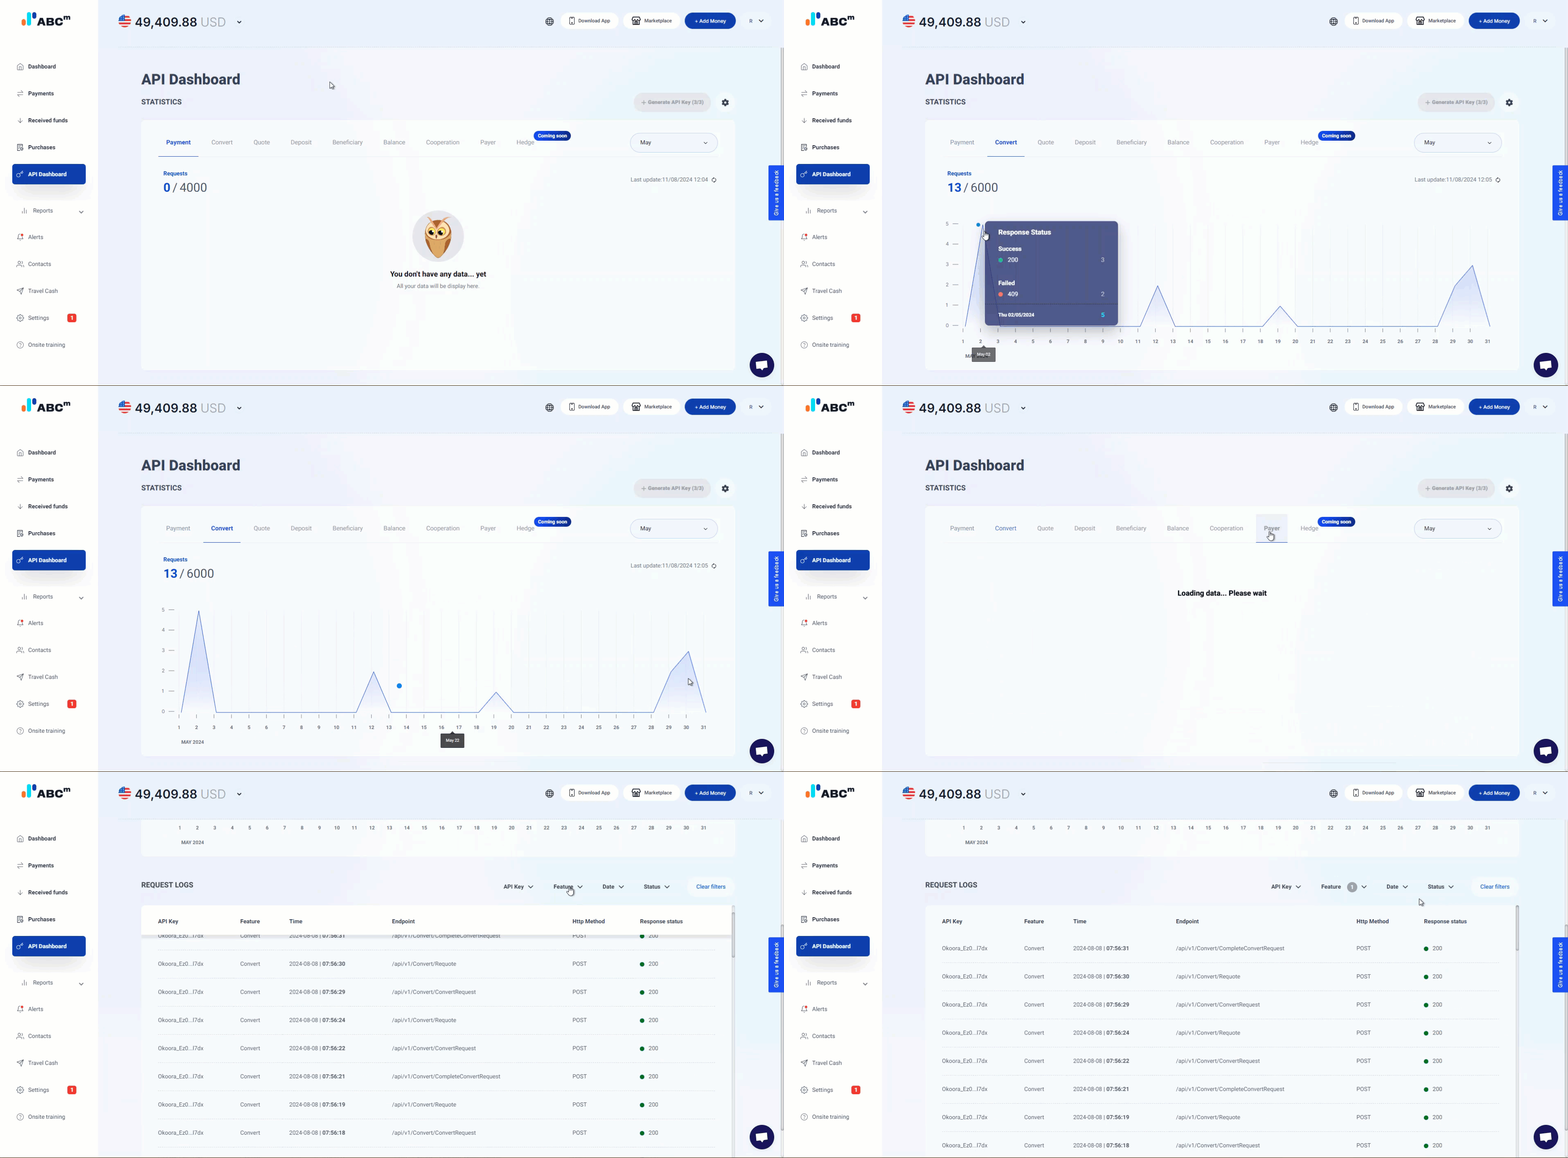
- Usage by feature (chart) - A visual summary of requests grouped by API feature. Use the chart to:
- see daily volume per feature
- follow your month-to-date usage trend
- identify peaks that may come from batch jobs or repeated retries
- This view is your fast signal for “is everything normal?”
- Request history (log) - A detailed timeline of every request made by your API account. Use request history to:
- filter by time range
- drill into a specific feature
- review response statuses
- spot repeated failures or throttling
- confirm that retry/backoff logic behaves correctly
This view is your debugging source of truth.
Best practices for stable usage
Follow these patterns to reduce noise and avoid hitting limits:
- Review usage routinely - Catch trends before quotas or bursts become a problem.
- Treat spikes as bugs until proven otherwise - Investigate immediately - they’re often avoidable.
- Stay efficient:
- cache stable / slow-changing data
- batch requests where possible
- use webhooks instead of polling
These practices improve performance and keep integrations reliable at scale.
Updated 11 months ago
What’s Next
To understand limits and retry behavior, continue to:
Rate Limiting
You’ll learn how quotas work and how to handle 429 Too Many Requests.
Did this page help you?